Previous page
The reflectance spectrum window looks like this:

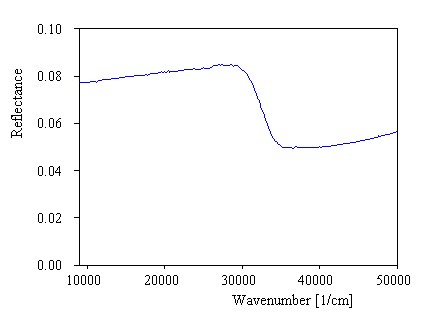
Use the Import menu item to open a spectrum data file. In the file dialog you can specify the import format that is to be used for reading the file. Open the file glass_r.spc using the SpectraCalc format. The experimental data range from 9000 to 50000 1/cm. The spectrum is the following:
Note that both R and T must be absolute reflectance and transmittance spectra, scaled between 0 and 1. If your data are scaled in %, i.e. their range is from 0 to 100, you can press the 'Divide by 100' button to change the range of the spectral values.
Next page