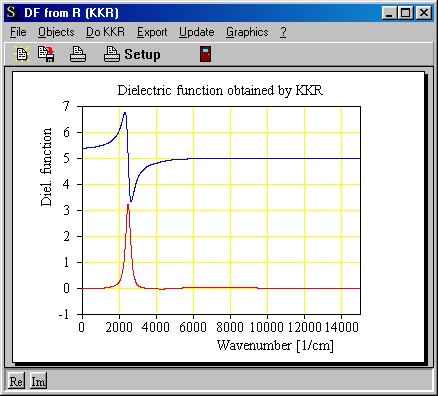
Start the R to DF program (r_to_df_by_kkr.exe). If you did not change the file start.kkr that contains the start configuration you should see the following main window:
In this first step you will import the experimental data. As explained in the program overview you have to do that in a subwindow. Open this subwindow with Objects|Input spectrum: Intensity reflectance and observe this:
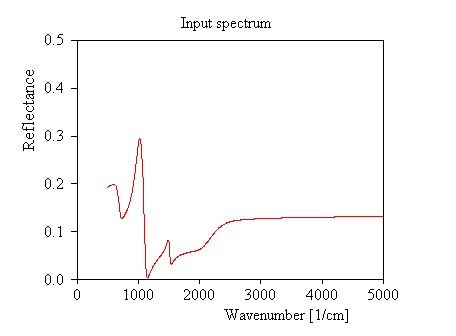
Here we see the measured data and the extrapolations. The subwindow for importing the measured spectrum is opened with the command Objects|Experimental data:
Select the menu command Import and choose the file refl_demo_0.xy that contains the test data. The graph now looks like this:
Note the step-like onset of the backside reflection below 800 1/cm and above 2000 1/cm (see also the transmission spectrum in the introduction of this example). Here we have to replace the reflectance spectrum by extrapolated data.
In case you could not follow this example up to this point you can load the present configuration (using the command File|Open in the main window) from the file step1.kkr that is distributed with the program.