These objects visualize the dependence of 2 selected quantities on a model parameter. The objects are based on the object type 'Function fluctuation' (see above) with the difference that no parameter fluctuations are considered but a systematic variation of a single model parameter.
The object dialog is this:
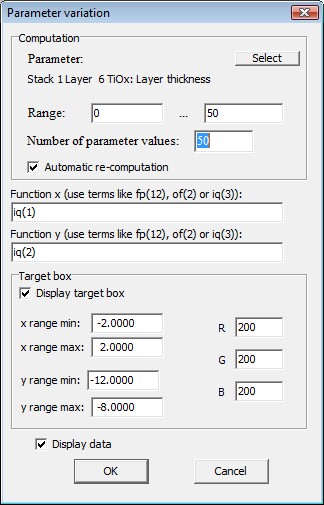
The parameter to be varied is selected in the section 'Computation' by pressing the Select button. The parameter range of the variation is set by specifying the minimum and the maximum of the value range and the number of parameter values to be taken into account. For each individual parameter value the optical model is re-computed. If you have a complex and large model, please be careful not to take too many points in the parameter variation.
The object will display a graph of pairs of x- and y-values. The number of pairs is given by the number of parameter values. The x-values are computed from a function which is defined as 'Function x' - the y-values are taken from 'Function y'.
The functions are defined by a user-defined formula which may refer to the current values of fit parameters, optical functions and integral quantities (CODE only). The expression 'fp(1)-fp(2)', for example, returns the difference of the first and the second fit parameter. Terms like 'of(4)' return the current value of the fourth optical function (element of the list of optical functions). In CODE you can use the values of integral quantities in the function, where iq(7) represents the value of the seventh integral quantity.
The CODE configuration sc_parameter_variation.wcd demonstrates the use of 3 parameter variation objects. These show how the color of a low-e coating changes with layer thickness for the base oxide (TiO2), the silver layer (Ag) and the top oxide (SnO2). The three graphs of the parameter variation objects are superimposed in the lower right corner of the main view:
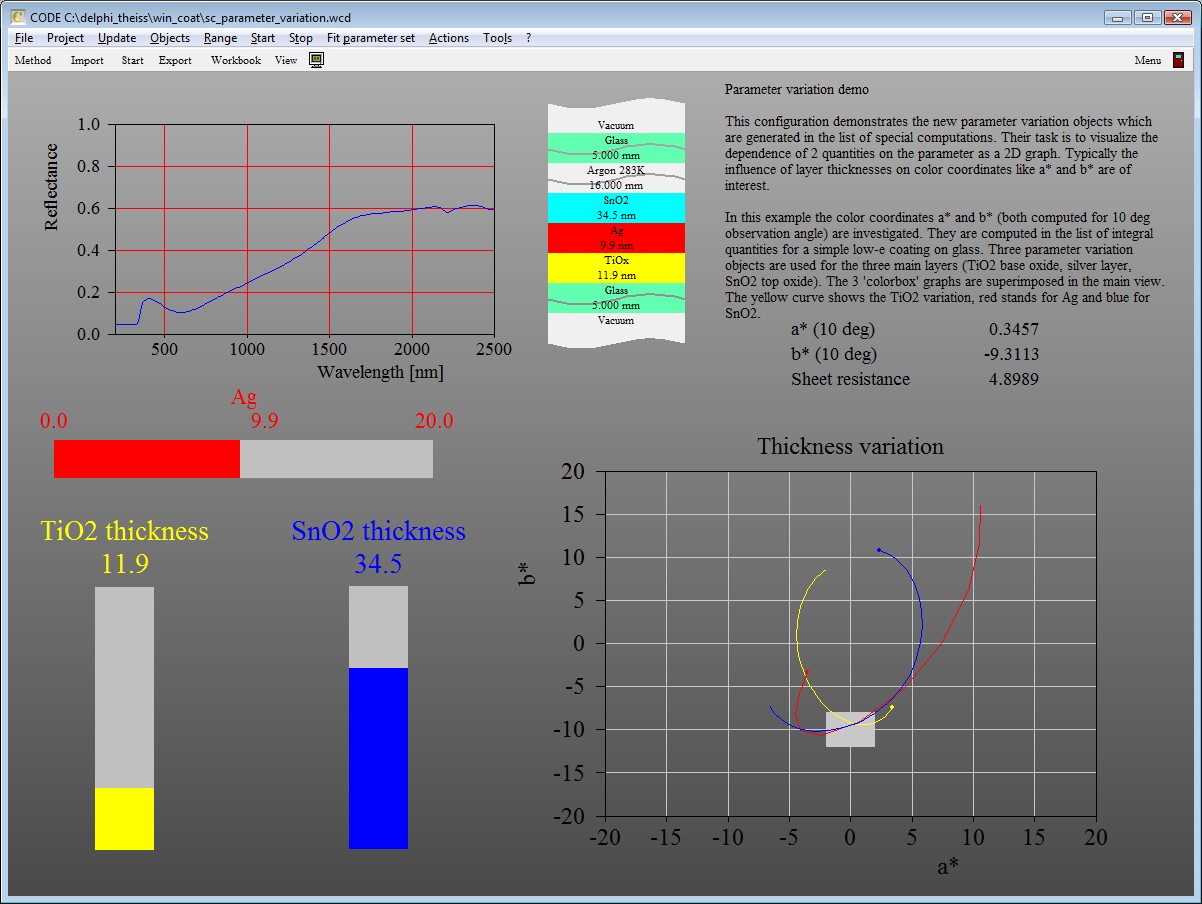
The little dots at the end of the curves indicate the minimum value of the parameter range. The color point where all three variation curves cross is the color of the current coating. These color values are shown as numbers above the variation graphs.